We’re present this month’s excerpt from Future Horizons’ April report on the semiconductor market. Read on to discover the latest insights and outlook for the industry.
Executive Summary
Annualised growth rates turned up in February, with Total Semiconductors growing 20.7 percent, up from last month’s 14.8 percent, but still down from November 2024’s 22.8 percent high and August 2024’s 28.5 percent cyclical peak.
Logic continued to be the star sector performer, at a healthy 35.8 percent growth, up from 29.7 percent in January, with second-place Memory growing 26.6 percent, down from 29.9 percent in January.
Analog ICs moved back into positive territory in February, growing 8.8 percent, vs. minus 0.4 percent in January, as too did Total Micro, growing 2.6 percent up from last month’s minus 0.4 percent.
The overall IC market ended up growing 24.1 percent year-on-year, up from last month’s 19.4 percent number but significantly lower than November 2024’s 29.5 percent growth and August 2024’s 36.2 percent peak.
The overall trends, however, are still indicating retrenchment vs. recovery, having been now on a downward trend for the last six months. We do not expect this trend to turn up anytime soon.
Annualised growth rates are, however, just one side of the coin. Our preferred measure is the month-on-month revenue growth trends, which we believe are a more accurate reflection of the overall industry health.
Thankfully, February saw monthly sales grow 6.5 percent vs. January, reversing January’s 5.6 percent, December’s 8.7 percent and November’s 8.7 percent decline.
Even more thankfully, this growth was broadly spread across all IC sectors bar Analog, which is still gripped in recession.
Market Growth Indicators
December 2024 saw the industry move into death cross territory, with the 3/12 curve declining further in February, to 17.1 percent, vs. 17.9 percent in January 2025, 8.2 percent in December 2024, and September 2024’s 23.7 percent peak.
At the same time, the 12/12 curve continued its gradual decline, at 19.4 percent vs. 19.7 percent in January and its 20.2 percent December cyclical peak.
As a result, the gap between the two curves widened slightly to 2.3 percentage points, vs. 1.8 percentage points in both January 2025 and December 2024.
WW SC Growth Momentum Indicator
(Jan 2001-Feb 2024 – Percent of US$)
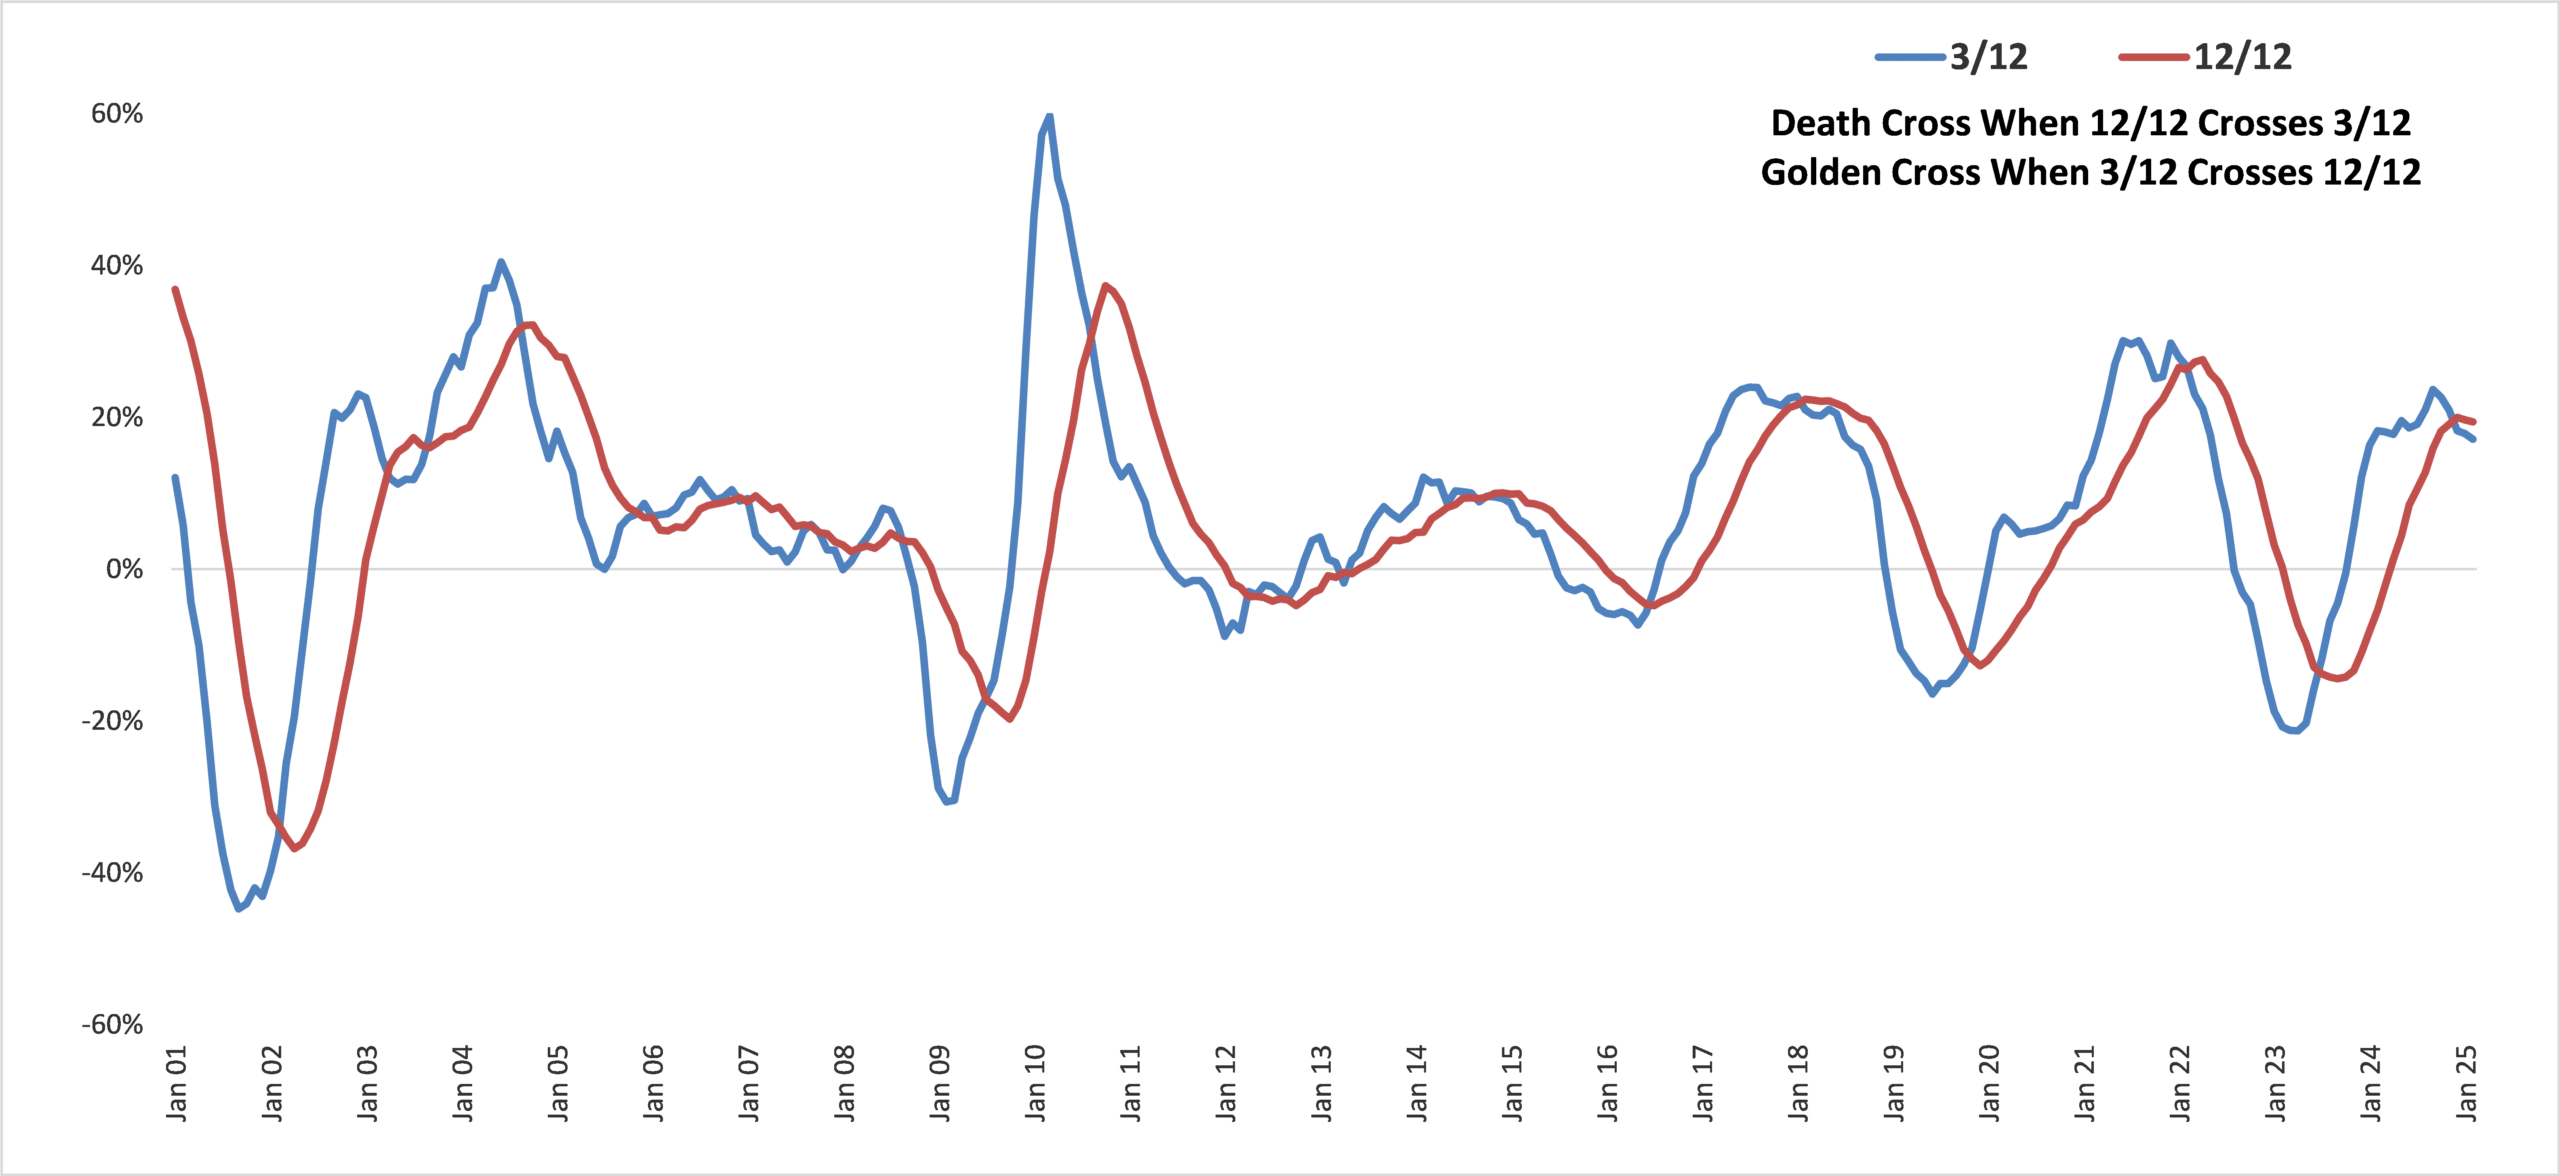
There are three potential scenarios now in play, depending on how the 3/12 curve plays out.
Scenario 1: The 12/12 curve continues its cyclical decline but the 3/12 curve flattens off heralding a modest Golden Cross sometime in the mid- to late-2025, as in 2018.
Scenario 2: The 12/12 curve continues its cyclical decline with the 3/12 curve following its more typical decline trajectory, paving the way for an extended industry walk in Death Cross territory throughout the whole of 2025, as in 2014.
Scenario 3: The 12/12 curve turns back up whilst the 3/12 curve continues its decline, heralding a much stronger Golden Cross sometime in the first half of 2025, as in 2003.
At this juncture, it is hard to predict which scenario is most likely but, if the broader chip market continues its slow and modest recovery and the current AI-inspired boom does not crash and burn, then Scenario 1 is the most likely outcome.
You can read the full March report here: https://www.futurehorizons.com/page/137/